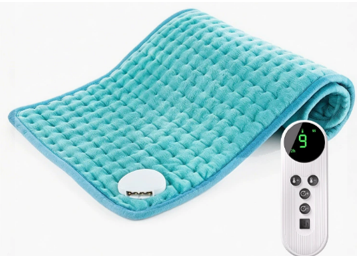
Estimated net profit is negative at current model. Likely a sourcing-cost issue, pricing problem, or this is an anchor product to show a poor opportunity. Flag for review.
What's a Pro-Forma?
A forward-looking financial model that puts your unit economics at maturity based on our market research.
How to Read It
The three signals up top explain why we picked this product. The calculator lets you stress-test price and unit velocity. The cash section shows what you'll need to get live.
Why We Picked This Product
The Three Signals That Matter
Demand depth, traffic cost, and proven unit economics. Everything else is noise. KPI thresholds: yearly search ≥ 500K · CPC ratio < 5% · positive net margin.
Yearly Search Volume
—
Aggregate top KW
CPC Ratio
—
CPC ÷ MSRP · lower is better
Est. Net Profit / Unit
—
Estimated · after all costs & CAC
Pro-Forma Calculator
Model Estimated Sales & Profit Over Time
All figures below are pro-forma estimates. Adjust units, price, or target gross margin. MSRP and gross margin are linked — change one, the other recalculates. Edited fields glow blue.
Estimated Sales Over Time (12 months)Ad SalesOrganic Sales
Estimated Profit Over Time (12 months)
Revenue
3-Year Cumulative
—
Year 1—
Year 2—
Year 3—
Profit
3-Year Cumulative
—
Year 1—
Year 2—
Year 3—
Equity Valuation
Year 3 · SDE × 2.5 × 0.85
—
Year 1—
Year 2—
Year 3—
Cash Requirements
What It Takes to Get Live & Stay Live
Two separate buckets — money to launch (one-time) and money to keep operating safely (ongoing).
Order Quantity—
Working capital is the cash you keep on hand after the launch is funded — so the business can keep buying ads and reorder inventory without choking. Without it, a sold-out winner turns into a stalled launch. We size working capital so you have 60 days of ad spend in the bank plus 50% of your next inventory order ready to deploy.
Inventory (Total Cost of Goods)
— units × — landed—
Total Initial Upfront—
Ongoing · Working Capital Reserve
Working Capital
60 Days of Ad Spend
$20/day default · scales with launch heat$1,200
50% of Next Inventory Round
Reorder cushion before sell-through—
Total Working Capital—
Velocity
Sell-Through at Input Pace
—
Time to deplete TOQ at modeled units/mo
First Cycle Cash Flow
Running Bank Balance — Month 0 to Reorder Month
Walk the bank from the inventory check on Month 0 through the Buy Box-safe price ramp into mature steady state. Each row shows gross margin per unit, cash impact, running bank balance, and the implied equity value if the business sold at that stage.
Default: $1,200 ads + 50% × next inv
Where listing opens
Phase / Milestone
Units
Gross Margin
Cash Impact
Bank Balance
Equity Value
?
—
—
Ramp Unit Cap
Max units the listing can sell during the ramp before cycle-1 economics need a capital injection.
—
— of TOQ
Investment Comparison
How This Stacks Up · 3-Year Horizon
—
FBA · 60% RISK-ADJ
This Product
—
—
Y3 Equity (×0.6)—
3-Yr Profit (×0.6)—
EQUITY
S&P 500
—
—
Position (10%/yr)—
Dividends (1%/yr)—
FIXED INCOME
10-Yr Treasury
—
—
Principal (flat)—
Interest (4.5%/yr)—
REIT*
Real Estate Fund
—
—
Position (4%/yr)—
Dividends (4%/yr)—
COMMODITY
Gold (GLD)
—
—
Position (6.5%/yr)—
Dividendsnone
REAL ESTATE
Rental Property
—
—
Y3 Equity—
3-Yr Cash Flow—
FBA 60% risk adjustment — cumulative profit and Y3 equity are multiplied by 0.6 (a 40% haircut) to reflect operational risk: supply-chain hiccups, Amazon policy changes, demand softening, and execution variance. Passive investments don't carry that risk so they aren't haircut. *REIT = Real Estate Investment Trust (e.g., Vanguard VNQ). Direct Rental Property only appears when capital ≥ $80K — below that you're locked into condos in low-cost markets where the math gets unreliable. All non-FBA returns are long-term historical averages; actual year-to-year performance varies. FBA Y3 equity (pre-haircut) = SDE × 2.5 × 0.85, excluding inventory at close.
No Longer Available
Recently Sold
Claimed by other clients — no longer open for new contracts.
Angora Go · Product Opportunity Pro-Forma · All figures are forward-looking estimates
*Disclaimer: Individual results vary, and success is not guaranteed. Any financial performance, revenue, profit, or operational projections are provided for informational purposes only and should not be interpreted as a promise, representation, or guarantee of future performance.